Spotting Tomorrows Top Flat Stallions
Spotting Tomorrows Top Flat Stallions: Who'll Do It?
(Based on an original article by Brian Mayoh, writing in the Racing Post’s “Good Morning Bloodstock”)
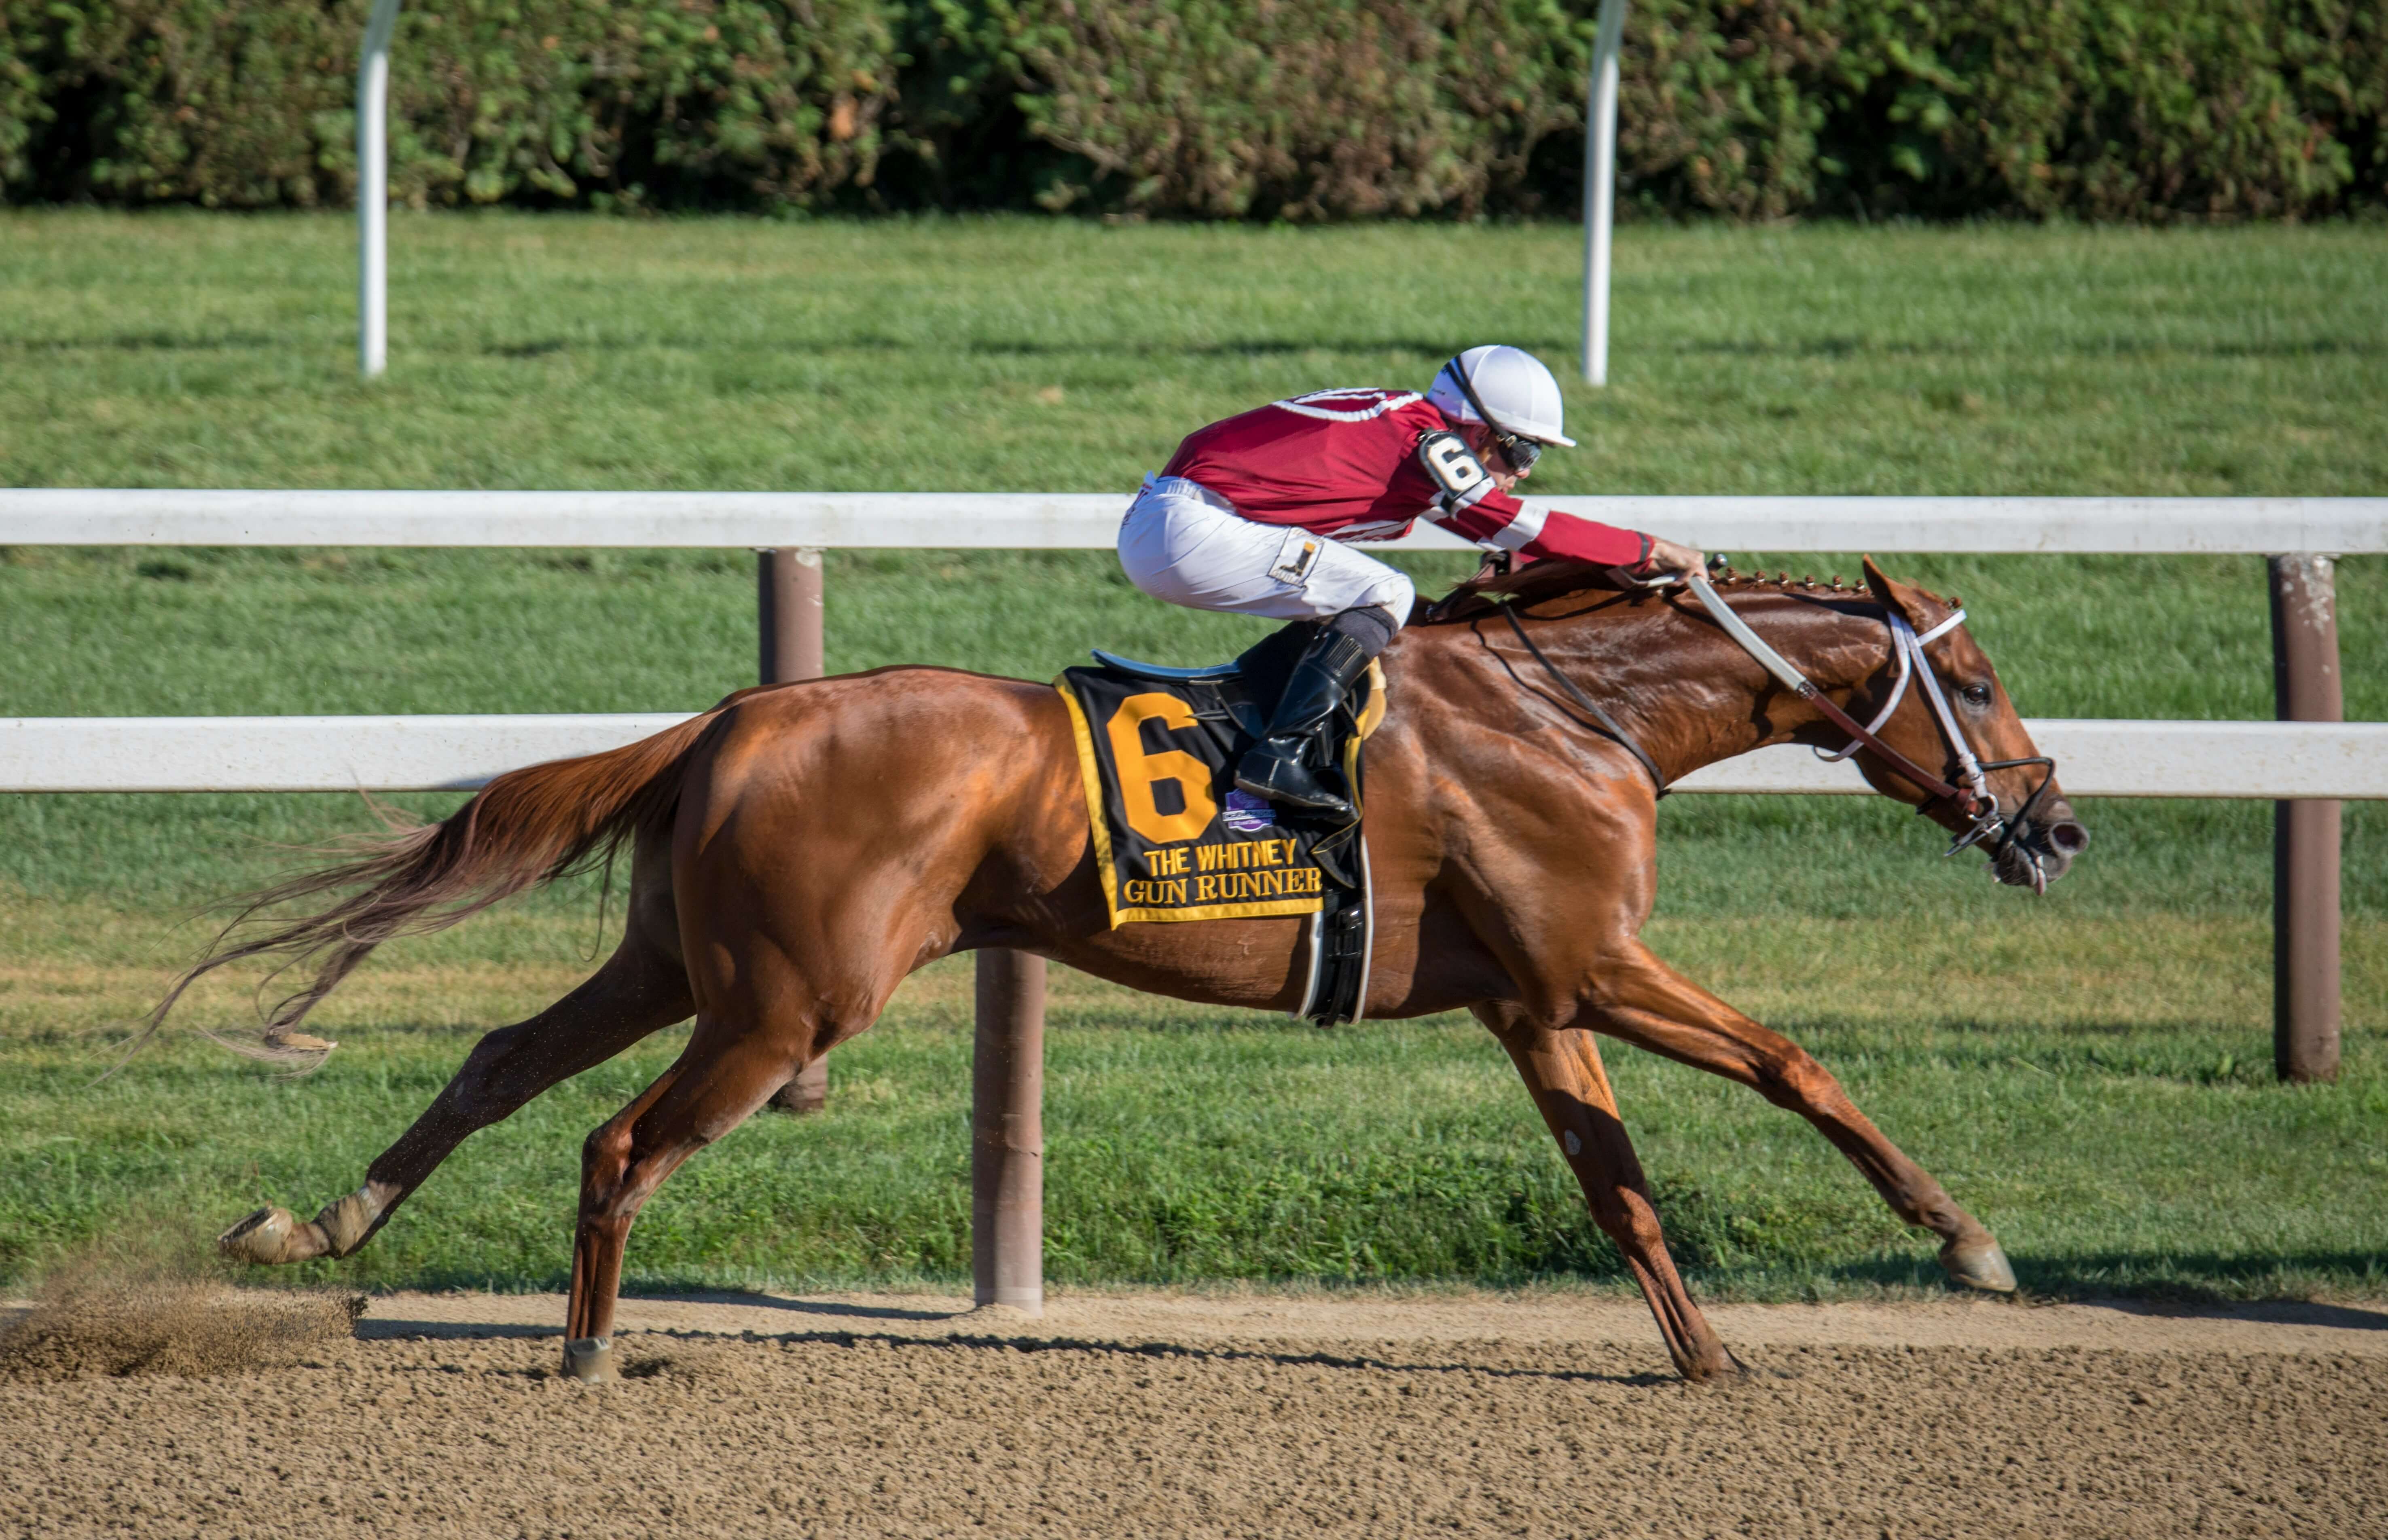 Racehorse Gun Runner
Every year a fresh batch of stallions heads off to stud in Britain and Ireland, usually with glowing write-ups from the stud owners. The racecourse record is served up minus the forgettable bits, funnily enough, along with gushing praise for the pedigree, the conformation and the temperament.
A few years on, most of them have flopped. Some get shipped off to far-flung places, while others drop to smaller studs or slash their fees in the hope of a comeback. The competition is brutal, and the vast majority simply can't make it. Even the top ten per cent of Flat sires, who should be set for the long haul, can hit trouble.
Take Golden Horn, who started at £60,000 and now mostly covers National Hunt mares for £10,000. Australia began at €50,000 and has bounced between €10,000 and €15,000 lately. Gleneagles launched at €60,000 and has been stuck at €15,000 to €20,000 for five years. Champion stayer Trawlerman, dual Derby winner Lambourn and six-time Group 1 winner Calandagan might have been expected to stay popular, but apparently more was expected!
Even sires who ended up in the top 15 per cent of Flat stallions in the statistics used here (more on those below), such as Daylami, Generous and Rock of Gibraltar, saw their fees collapse before their careers were over.
So how can the winners be distinguished from the losers? It's less a "whodunnit" and more a "who'lldoit?". Without Nostradamus-level powers of prediction, the sensible approach is to look back and ask which factors would have flagged what actually happened.
Unless keeping piles of stallion stats is someone's idea of fun, the options are to skip all this and trust gut feeling, or to see what one particular humanoid has dug up.
What Counts as "Stallion Success"?
Before success can be explained, it needs defining. Group winners could be counted, or their percentages worked out. The problem is that this looks only at a handful of top-class horses and ignores the many ordinary ones, who matter most to most people deciding whether to use a stallion.
The analysis here therefore covers every single runner a sire has had, using the Racing Post Rating (RPR) from each horse's best performance. The full details are in the appendix, but the idea is simple.
One calculation gives the average RPR of all a stallion's runners. A second gives an average weighted for the fact that higher-rated horses earn far more prize money. A 50/50 blend of the two, the "Combined RPR", is used to grade established sires.
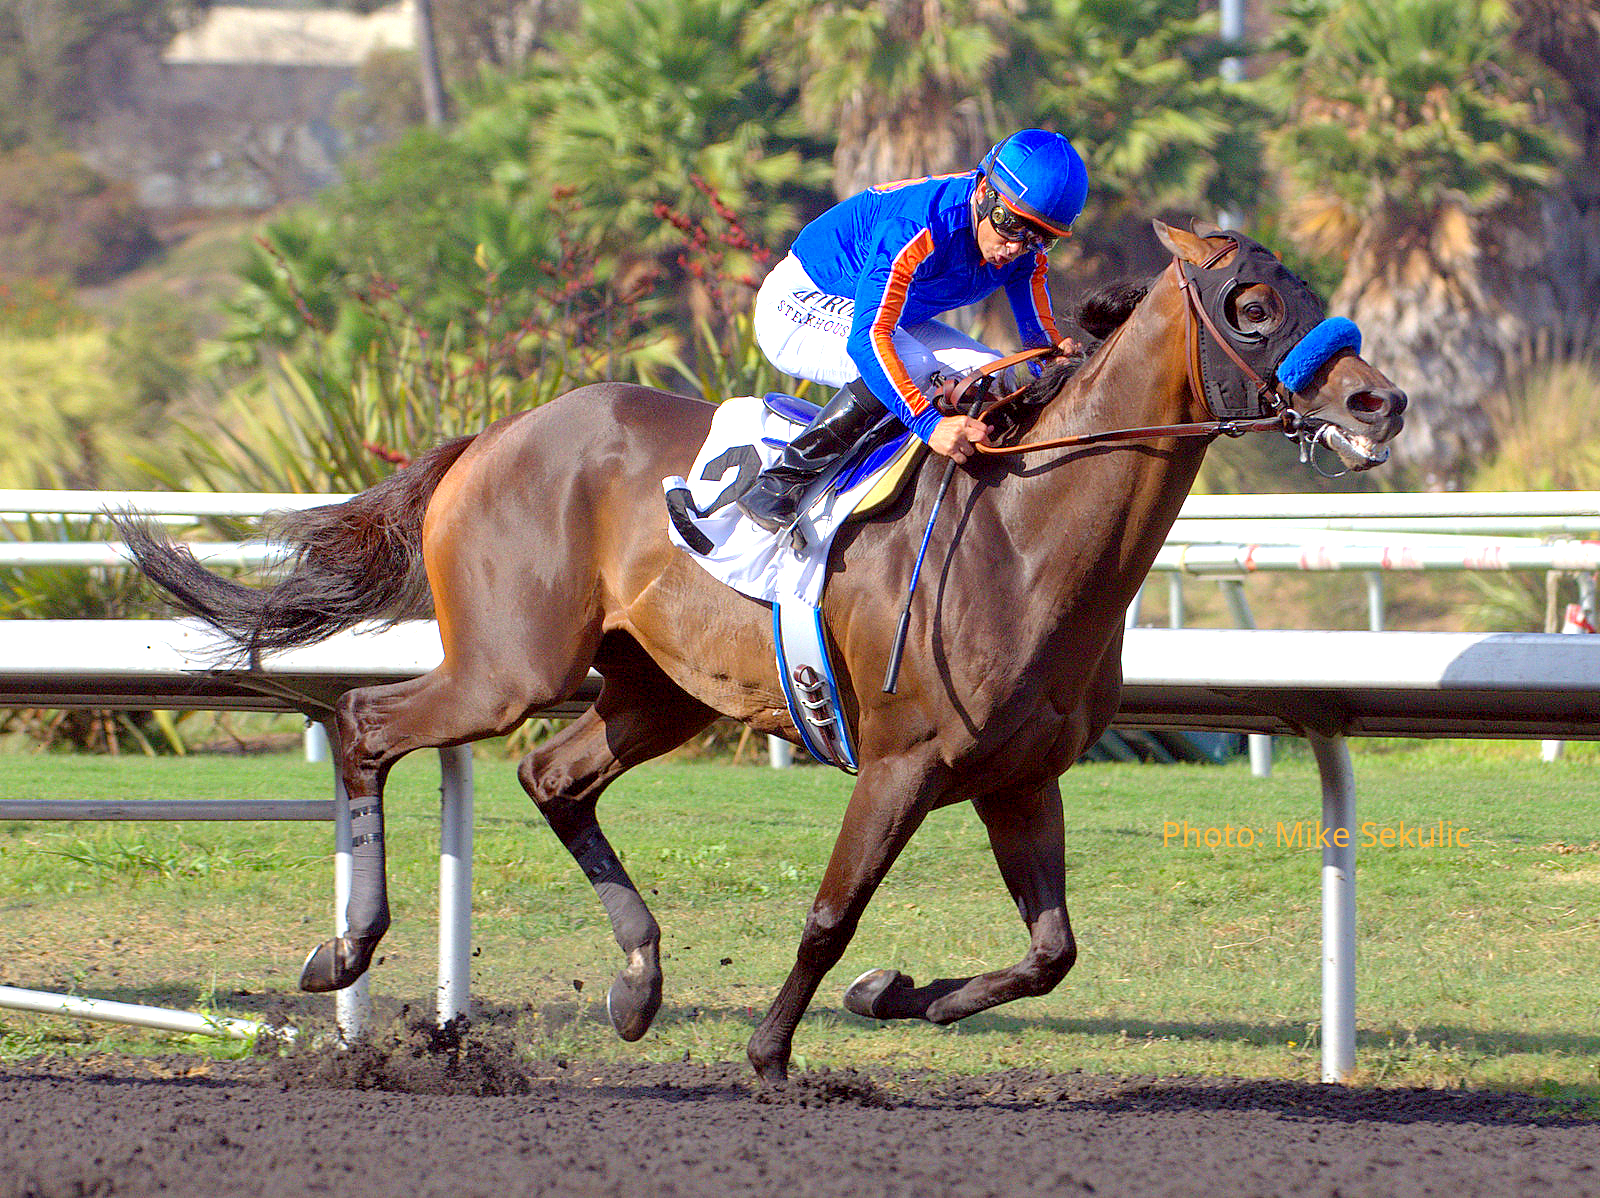 Game On Dude wins Hollywood Gold Cup
Outstanding (90+): As of the end of 2025, ten stallions made the grade. They come from the 383 analysed, whose first crops were foaled between 1990 and 2019: Frankel (94.9), Galileo (94.6), Dubawi (93.9), Danehill (93.8), Sea The Stars (91.1), Lope De Vega (91.0), Kingman (90.7), Machiavellian (90.5), Shamardal (90.3) and Montjeu (90.1). Machiavellian might raise an eyebrow, since his best horse (Street Cry) only reached 127. But 11 other offspring hit 120+.
Good (85 to under 90): 36 sires. The top ten are Dansili (89.3), Warning (89.0), Night Of Thunder (88.9), Pivotal (88.8), Selkirk (88.7), Singspiel (88.6), In The Wings (88.5), Farhh (88.5), Zafonic (88.0) and Nashwan (88.0). Just behind are Cape Cross, Indian Ridge and Invincible Spirit on 87.3. Well-known current stallions in the same group include Golden Horn (86.8), No Nay Never (86.3), New Bay (85.9) and Dark Angel (85.7).
Useful (80 to under 85): 81 stallions, including Starspangledbanner (84.7), Australia (84.6), Nathaniel (84.3), Mehmas (82.7) and Sea The Moon (82.6).
Fair (75 to under 80): 128 stallions, such as Shirocco (79.6), Dr Fong (79.1), Refuse To Bend (78.6), Kyllachy (78.4) and Hawk Wing (78.0).
Moderate (under 75, down to 55.6): Also 128 stallions. Disappointments include Xaar (74.7), Tobougg (73.1) and Cockney Rebel (71.0), and then there are the bottom two, River Falls (57.1) and Wizard King (55.4).
These details aren't given to gush over the stars or sneer at the strugglers. The point is to show that Combined RPR separates the best from the worst, with plenty in between. Anyone still unconvinced hardly needs telling to stop reading, assuming they got this far!
How Success Was Predicted
The starting point was the genetic factors most likely to matter. First comes the stallion himself, then his sire and dam (first generation), then his maternal grandsire and granddam (second generation).
The reasoning runs like this:
- A horse's genetic influence roughly halves with each generation back, so the stallion himself should matter more than his parents, and they should matter more than his grandparents.
- For a new stallion's sire, there is probably plenty of information from his offspring's results. After a few years at stud, those reveal far more than his racing ability does.
- The sire's produce record should therefore say all that's needed about the top half of the pedigree. His own sire's racing record, or his paternal grandparents' racing and stud records, probably adds little beyond false comfort or needless worry.
- For the dam and her dam, progeny results can't be relied on in the same way, because the samples are tiny. Instead, the focus is on how good they were as racehorses and how well they did as dams of good runners.
So here are some simple stats to see what the data on established sires can reveal about newcomers.
NB: You can ask your AI Agent to find the qualifiers for this method
The study covers 383 stallions whose first crops were born from 1990 to 2019, which allows enough time to judge them by their Combined RPRs. Each had to have at least 100 runners in Europe, and offspring bred to southern-hemisphere time were ignored.
 Thoroughbred Racehorses at The Sales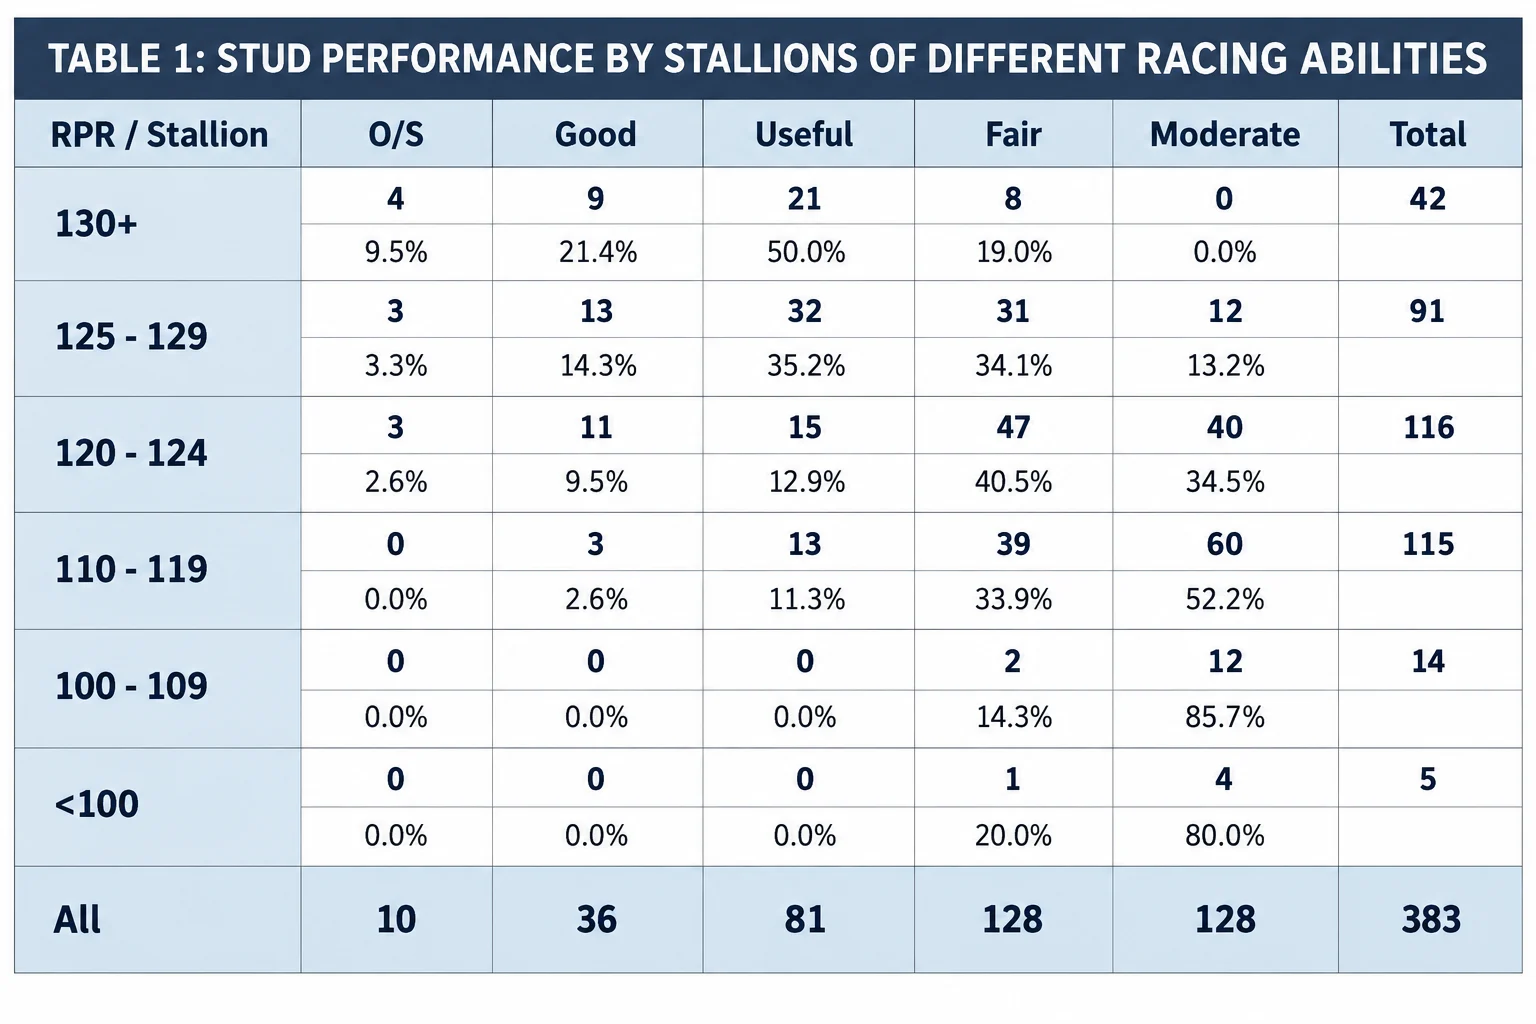
Table 1 shows how many Outstanding, Good, Useful, Fair and Moderate sires had been racehorses with RPRs of 130+, 125-129, 120-124, 110-119, 100-109 and under 100, plus the percentages. The key figures are the first two columns (Outstanding and Good) against each rating row.
The message is clear: the better the racehorse, the more likely he is to make a good sire. 30.9 per cent of 130+ horses became Outstanding or Good sires, against 17.6 per cent of the 125-129 horses and 12.1 per cent of the 120-124 ones.
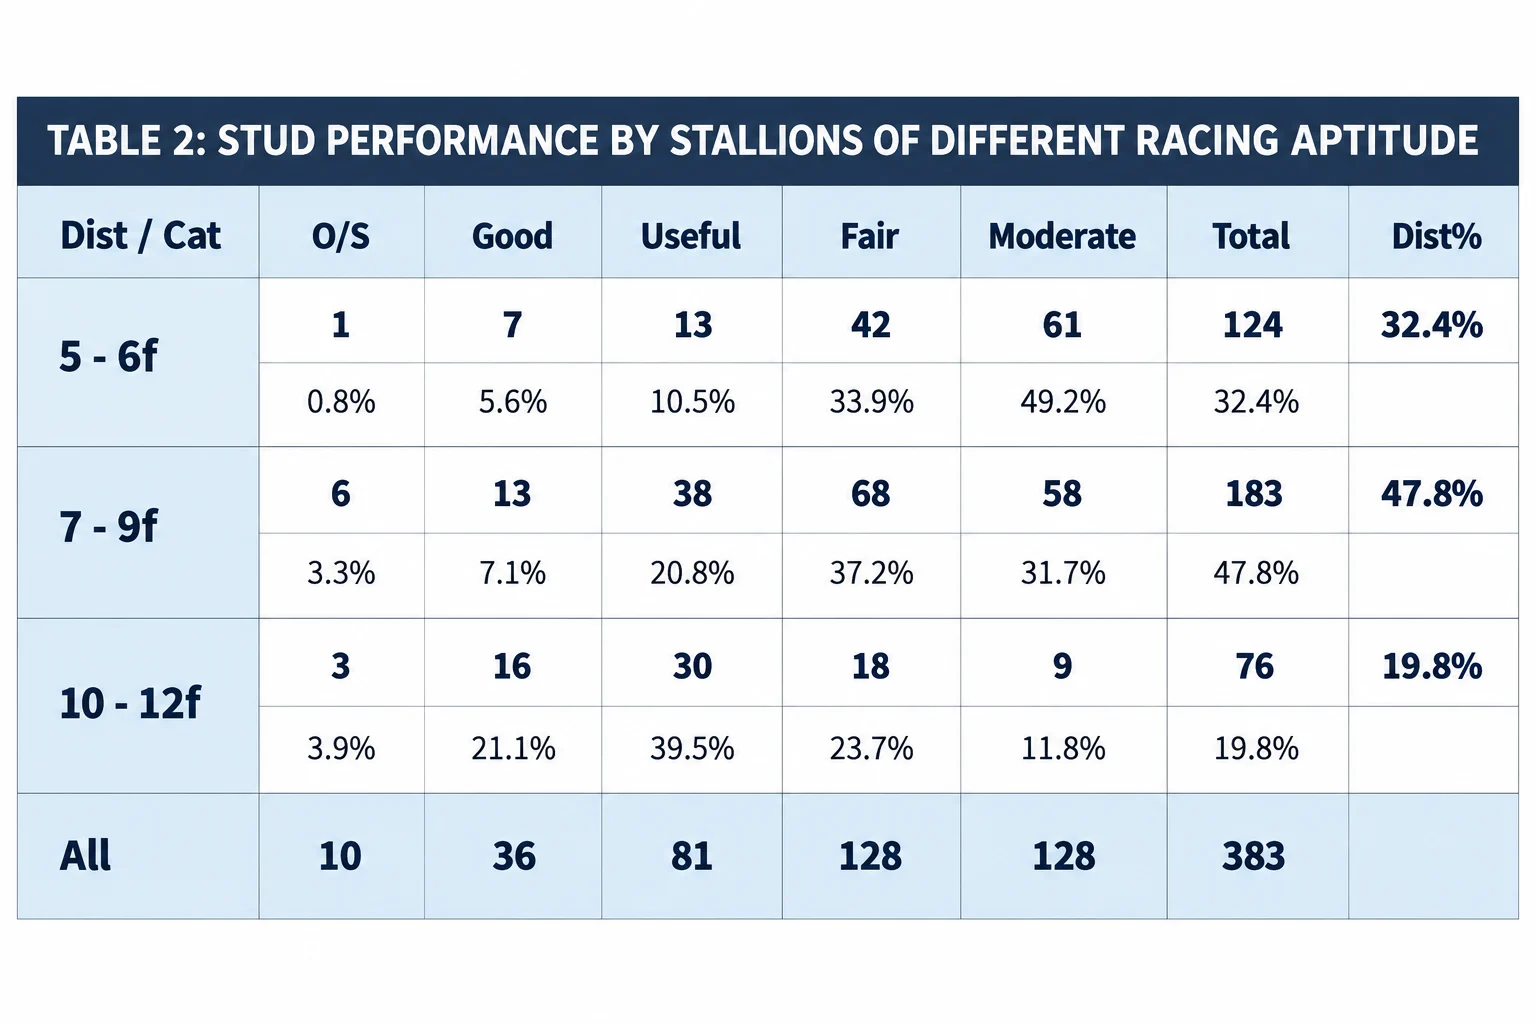
Table 2 splits sires by best racing distance: 5-6f, 7-9f and 10-12f. (None of the 383 sires with 100+ runners were stayers!) Again, the Outstanding and Good columns matter most.
It looks as though 7-9f and 10-12f horses are far more likely than sprinters to become top stallions. Only 6.4 per cent of sprinters ended up Outstanding or Good, compared with 10.4 per cent of 7-9f horses and 25.0 per cent of 10-12f horses. "Eureka!" some might say, and anyone wanting middle-distance horses to come out on top could stop right there!
Except there's a catch. It's often said that "you can prove anything with statistics". That's not quite true. It's more accurate to say that almost anything can appear to be proved by misusing statistics, and this is a perfect example.
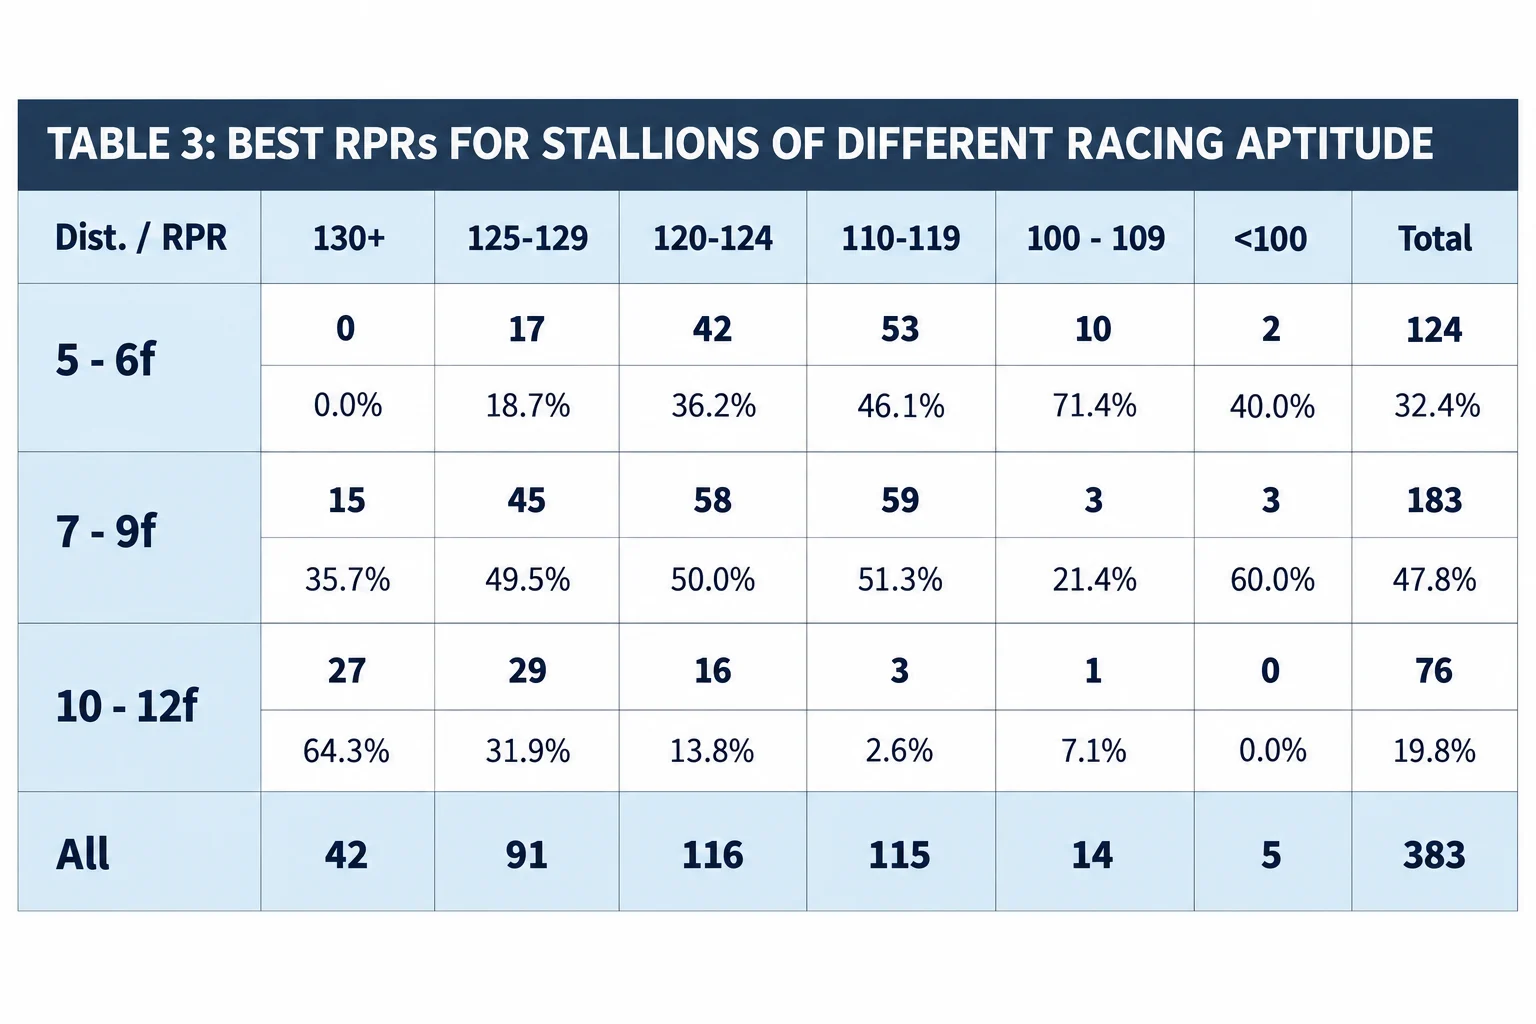
Table 3 shows why. It gives the best RPRs reached by horses of each distance type. Not one 5-6f stallion hit 130+, the mark of a top-class racehorse. Of the 130+ group, 35.7 per cent were 7-9f specialists and 64.3 per cent were best at 10-12f. Even in the 125-129 band, only 18.7 per cent were 5-6f horses, even though they made up 32.4 per cent of all the sires surveyed.
Meanwhile, the 10-12f group had far more highly rated horses than its overall share would suggest, with both the 130+ and 125-129 ratios above the overall 19.8 per cent. That could be because lots of 10-12f horses rated below 125 went off to be National Hunt sires, leaving fewer of them in the Flat sample of 383.
So best racing distance may not be as clear a guide to a sire's prospects as some (the author included) might hope. Whether it helps at all will be assessed in Part 2...
Next, pedigree may affect stud results regardless of how the stallion himself raced.
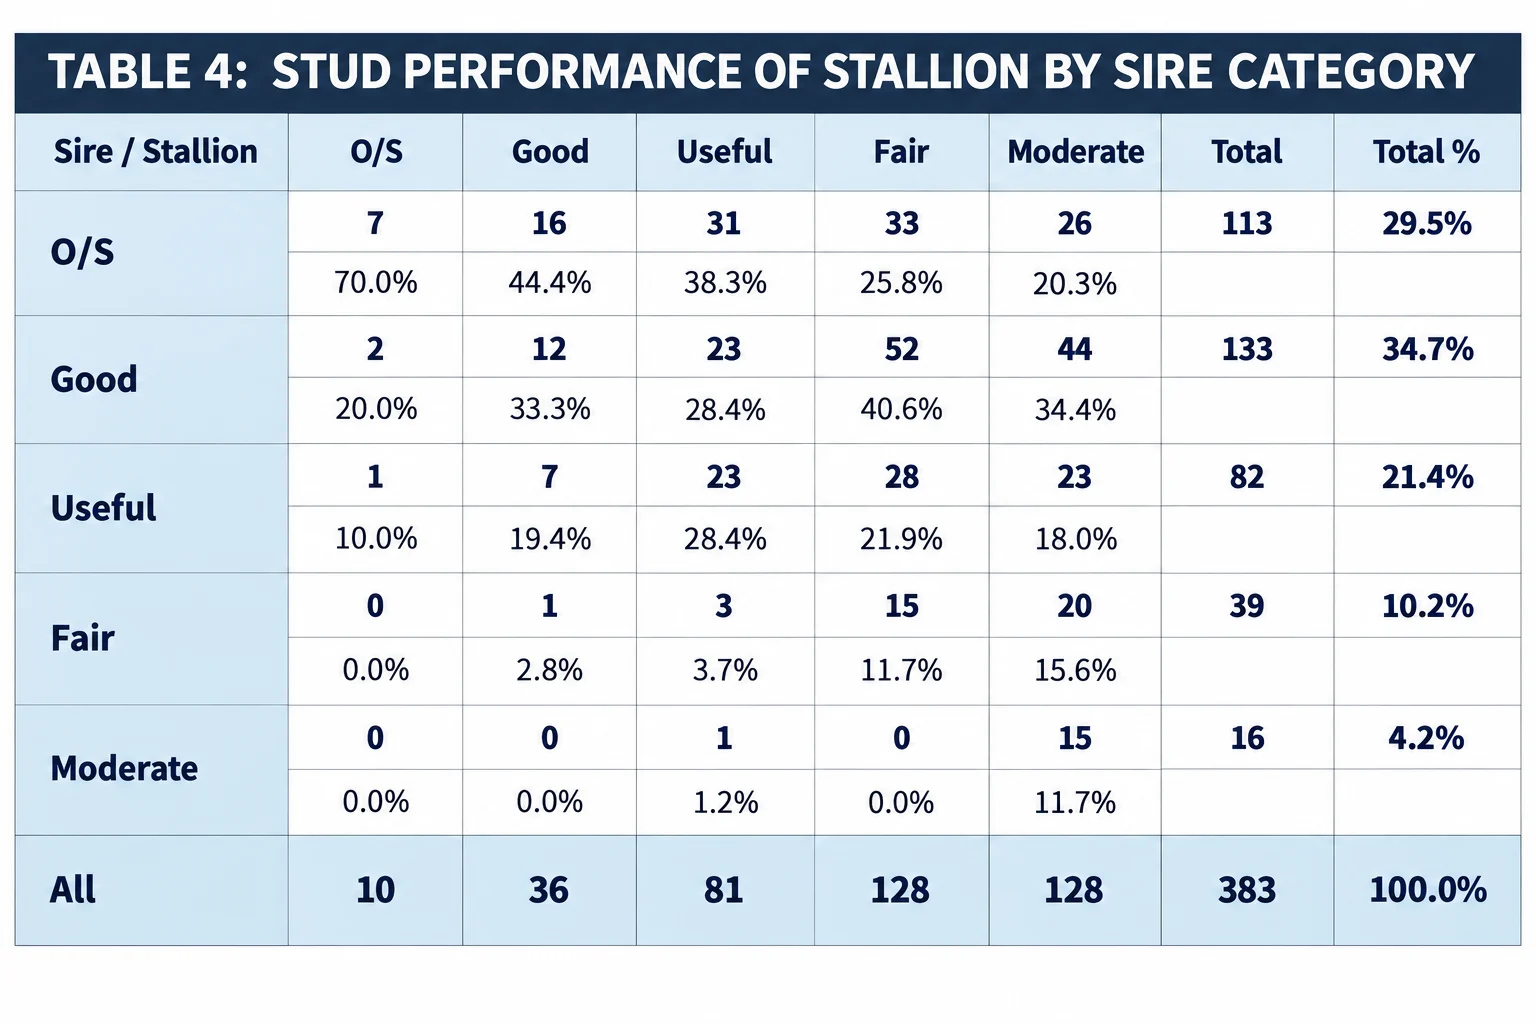
Table 4 compares stud success between stallions and their own sires. There's a clear link: seven of the ten Outstanding stallions in the sample were by Outstanding sires, and 23 of the 46 Outstanding and Good stallions came from Outstanding sires.
 American Pharoah
When It Comes To Spotting Tomorrows Top Flat Stallions This May Come As A Surprise
But this isn't totally shocking. Top sires produce more top racehorses, and as Table 1 shows, top racehorses are more likely to become top sires. Call it a "cause and effect conundrum".
Still, the link between a stallion's stud success and his sire's looks strong. Even allowing for that conundrum, knowing the sire's stud record might help predict the son's. More analysis is needed.
A similar comparison can be made using the dam's racing and breeding records, with a simple "Dam Score" devised for the purpose. Each dam got points for her own best racing result plus those of up to three of her produce. Points earned as a producer were half what she'd get as a racehorse, since a stallion deserves roughly half the credit for the offspring's result.
The points:
- Multiple G1 winner: 10 as racehorse, 5 as dam
- G1 winner: 8 as racehorse, 4 as dam
- G2 or G3 winner: 6 as racehorse, 3 as dam
- Listed winner or G1 placed: 4 as racehorse, 2 as dam
- G2, G3 or Listed placed: 2 as racehorse, 1 as dam
- Winner (just one): 1 as racehorse, 0.5 as dam
Each dam's score left out the stallion son being assessed, to avoid double-counting. That wasn't considered necessary for sires, since their samples are much bigger. Mares with 12+ points were "Outstanding" dams, 8-11 "Good", 5-7 "Useful", 2-4 "Fair" and 0-1.5 "Moderate".
A standout "Outstanding" dam was Urban Sea. She produced three multiple G1 winners plus the single G1 winner My Typhoon. That gave her a score of 22 (8+5+5+4) as dam of the Outstanding stallions Galileo and Sea The Stars. Only two of the G1-winning brothers could count for 5 points each, since the other was Black Sam Bellamy.
Ironically, when her score was 23 (8+5+5+5) for a sibling, because all three multiple G1-winning brothers counted, the result was only the "Useful" stallion Born To Sea. His sire, Invincible Spirit, had a Combined RPR very close to that of Sea The Stars' sire Cape Cross.
A Baldrick-like Cunning Plan
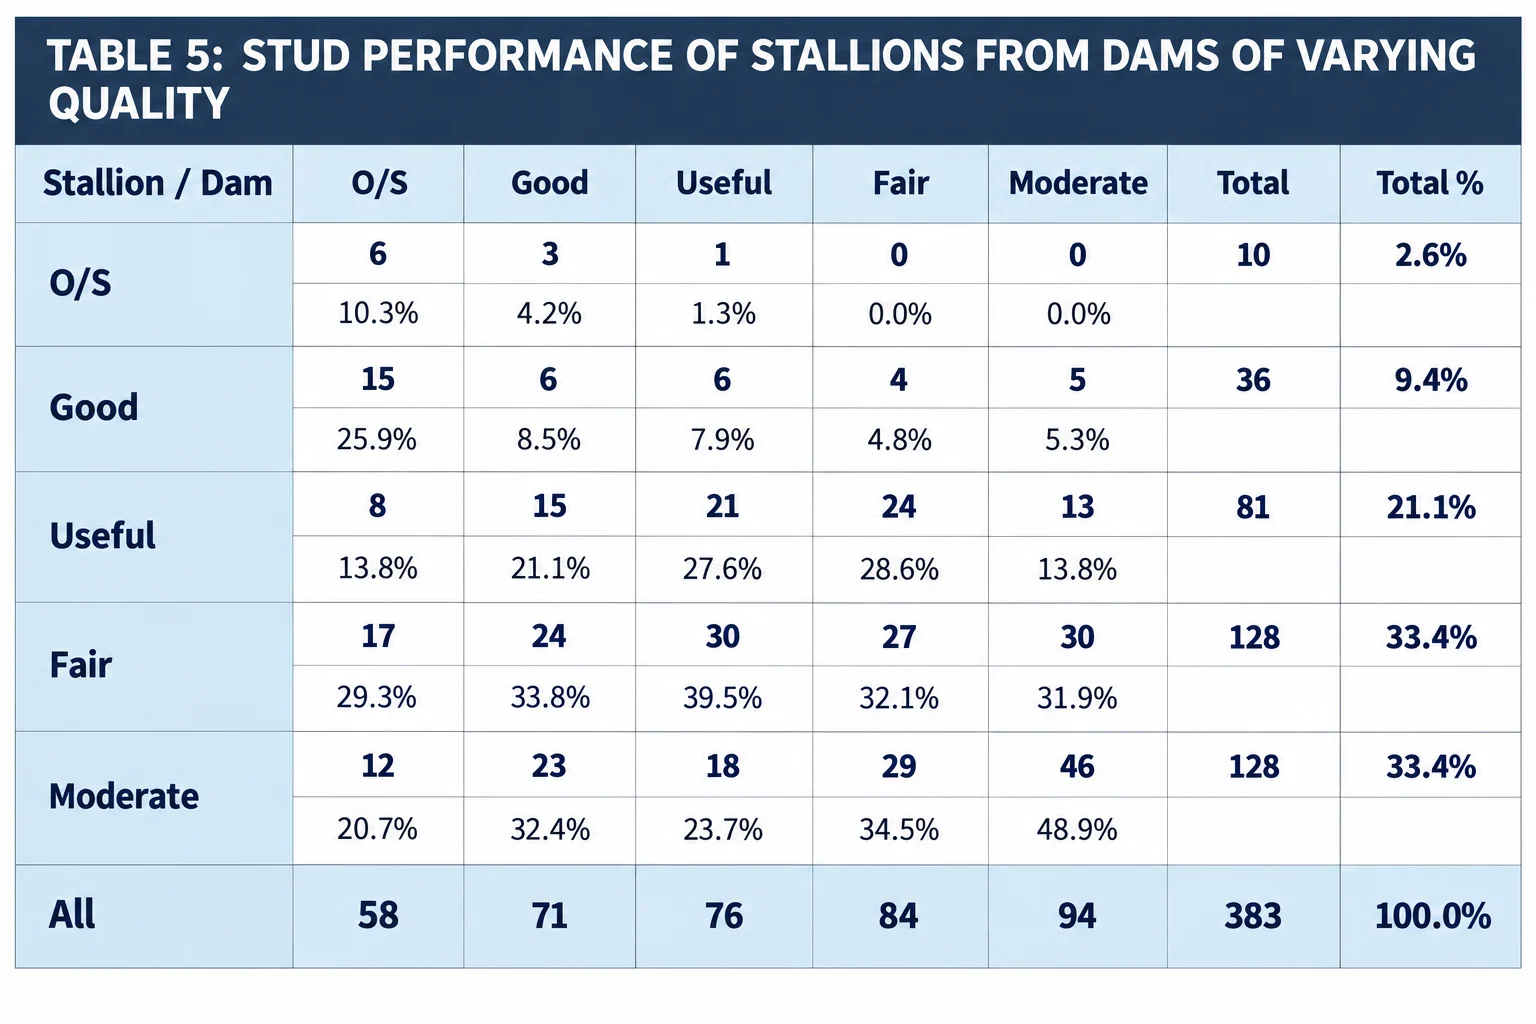
Anyway, Table 5 shows how stallions performed depending on their dam's level.
It might be argued from this that the dam matters more than the sire, because more Outstanding and Good stallions came from Outstanding or Good mares (30 of 129) than from similarly rated sires (37 of 246). But that comparison is flawed. Top mares are very likely to be sent to top sires, whereas top sires cover plenty of mares well below top level. There just aren't enough high-class mares to go round!
246 of the 383 stallions' sires (64.2 per cent) were Outstanding or Good sires, but only 129 of their dams (33.7 per cent) had reached similar status as broodmares. So the high-class mares faced less competition from others like them than the sires did.
It's fully accepted that the dam is at least as important as the sire, probably more so, since she shapes much of the environment the foal is born and raised in. But the question here is different: how can the stud success of a horse who has already been chosen to stand as a stallion be predicted? Both parents matter, but these tables don't reveal their relative weight for that purpose.
The next tables, comparing stallions with their damsire (rated like Combined RPR, using the stallion's "damsire" stats on the Racing Post website) and their maternal granddam (scored like dams), don't tell much either.
First, the link with the damsire is weaker than with the sire. 27 of 46 Outstanding and Good stallions (58.7 per cent) had damsires of similar level, against 37 (80.4 per cent) with sires of that level in Table 4. A fall-off between generations isn't surprising, but again the damsire's relative importance can't be pinned down.
As for the maternal granddam, if the table shows any link with her stallion grandsons' results, it's far from obvious. Stallions with granddams of all abilities look remarkably similar.
To forecast an unproven stallion's likely Combined RPR, it's not enough to say that his racing ability and pedigree matter. A way of combining them into the best possible prediction is needed. As the next article will show, the plan used for this was even more cunning than anything Baldrick could have come up with.
 Pedigree Thoroughbred Racehorses
Appendix: How Stallion Success Is Measured
Measurements for Spotting Tomorrows Top Flat Stallions
The measure is based on the RPRs of every progeny that races, with winnings used to estimate ratings for the few unrated horses.
To keep things manageable, RPRs are grouped into bands of ten: 140+, 130-139, 120-129 and so on down to 50-59, then under 50. A single value is used for horses under 50, and the midpoint of each band (e.g. 104.5 for 100-109), to work out each sire's "Average RPR".
The catch is that a simple average gives a 140-rated horse only twice the weight of a 70-rated one, yet their prize money differs by a factor of around 1,000.
So "Average Expected Earnings" are also calculated for each sire. Each RPR band has an Expected Earnings figure, starting at £4,000,000 for 140+, then £1,350,000 for 130-139, £450,000 for 120-129, and so on down to £1,000 for 50-59. Each is multiplied by the proportion of the sire's runners in that band, and the results are added up. These figures aren't predictions for individual horses, just the most likely earnings for a given band.
Next, the sire's Average Expected Earnings are converted back into the RPR that would likely produce them. For instance, £450,000 equals an "Expected RPR" of 124.5, midway between 120 and 129.
Finally, the Average RPR and Expected RPR are added together and halved to give the "Combined RPR", which is the basis for comparing stallions.


Returns Policy: Once a customer has agreed to pay for a product or service no returns will be permitted or payments returned.
All PayPal transactions are subject to the PayPal Privacy Policy
Privacy Policy: Personal details provided to this site by an individual may be shared with third parties unless requested otherwise.
Above policies updated 15 March 2018
Recent Articles


-
The Lucky 15 Bet: A Popular Multiple Bet Strategy
Oct 04, 26 05:04 AM
 The Lucky 15 Bet: A popular multiple bet strategy that can pay out even if only one selection wins, consisting of 15 different combinations
 -
Daily Lay Tips For Races In The UK And Ireland
Oct 04, 26 04:56 AM
 The free Daily Lay Tips will now only be available on weekends; however, you can subscribe to the full service for just £5 per month, as explained below.
 -
Greyhound Racing Locations For Stadia Throughout The UK
Oct 03, 26 04:27 AM
 Finding greyhound racing locations around the UK is quick and easy with this guide to dog tracks around the country