Lost Bet Management
A lost bet is not just money down the drain – it’s a blow to your esteem. Every time you have a losing bet it chips away at your confidence and you begin to lose faith in your selection process.

Stakes become less and the ability to recoup losses is reduced.
So what’s to be done and how can we rescue the situation and restore our confidence and pride?
The answer is a statistic that few people have ever heard of - Probability of Negative Return.
A mouthful to be sure but not nearly as daunting a prospect to calculate as the term would suggest. A few minutes of your time devoted to calculating this stat will ensure your lost bets do not result in the loss of your bankroll.
The idea of the stat is to establish whether your betting selections will show a profit over time. Winning and losing streaks in betting are to be expected but this calculation will iron out all the ups and downs and reveal whether you are going to consistently make money.
The more past selections you have to work with the better but aim for at least 100 for meaningful results.
How To Limit The Number Of Lost Bets
You will need an Excel spreadsheet, using certain of the functions available to do the maths. To demonstrate the process I am using some of my own selections for a system and include below a graphic of my calculations:
1) Calculate the percentage profit on each bet – if a win bet has odds of 5.65 then the profit is 565% and if the bet loses the return is -100%
2) Calculate the average of the percentage profits using the Excel Average function
3) Calculate the standard error of the result from step 2 using the formula =stdev(all percentage profits)/sqrt(number of selections)
For “all percentage profits” enter the cell which contains the result of Step 2 and “number of selections” with the number of selections.
4) We calculate the Normal Distribution of these figures with the formula =normdist(0,average of percentage profits,standard error,1)

Using my selections the calculations are:
2. Average of % profits =AVERAGE(G2:G2481)
3. Standard Error function =STDEV(G1:G2481)/SQRT(H2481)
4. Normal Distribution =NORMDIST(0,B2484,B2483,1)
The result you obtain should be between 0 and 1 (in my case it is 0.155) -the nearer to 0 the better so that 0.155 means a 15.5% chance of making a loss with my selections. Not too bad but 10% would be more reassuring and 5% ideal. I would be concerned if I was looking at 40%.
This method of assessing the viability of your selections is well worth the effort to limit the times when a loss can seriously reduce your bankroll.
I owe the concept of Probability of Negative Return to Michael Wilding of the Raceadvisor.
You might like these
Use Asian Handicaps to limit the outcomes of a sports betting event
Asian Handicaps are a way to bet on an event while limiting the number of outcomes
The Best Betting System Ever Devised
The best betting system lies within you and will depend on your experience and attitude towards betting
Betting Selections Strategy From Horse Racing To Roulette
Your betting selections on horse racing can influence your success on the roulette table with surprising results


Returns Policy: Once a customer has agreed to pay for a product or service no returns will be permitted or payments returned.
All PayPal transactions are subject to the PayPal Privacy Policy
Privacy Policy: Personal details provided to this site by an individual may be shared with third parties unless requested otherwise.
Above policies updated 15 March 2018
Recent Articles
-
Daily Lay
Apr 23, 24 04:43 PM
 Daily Lay Tips will appear before 9.0am on the day of racing. With regard to taking a price on the lay bets I suggest nothing higher than 5.99 on the
 -
Mobile Casinos Reviews For South Africans
Apr 15, 24 01:35 PM
 Mobile Casinos can be played on most devices nowadays but you need to know which ones are best
 -
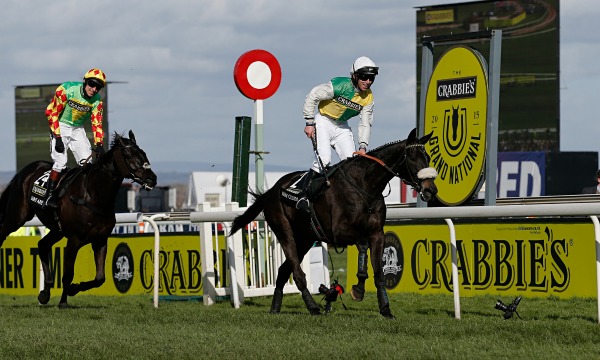
Which Horses Have Won The Biggest Races Back-to-Back?
Apr 12, 24 12:39 AM
 Which horses have won the biggest races back to back? Will Corach Rambler Repeat Grand National Glory?